TikTok Furniture Sales Up 8% in June: 3 Categories Exploding!
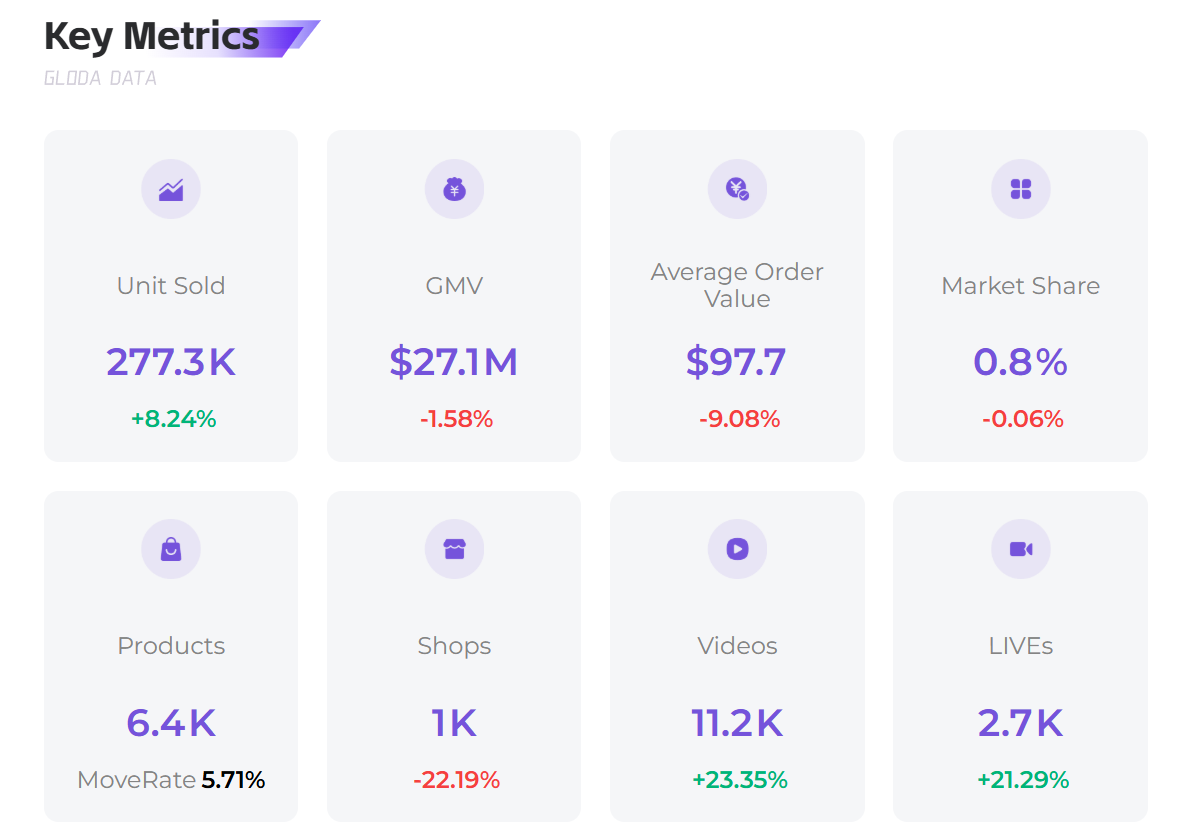
The TikTok Shop US furniture market demonstrated dynamic trends in June 2025. While the overall sales amount saw a slight month-over-month decrease of 1.58% to $27.10 million, the sales quantity actually increased by a notable 8.24% to 27.7 million units, indicating a stronger sales volume driven by potentially more accessible pricing. The average transaction price experienced a decline of 9.08% to $97.7, suggesting a shift towards more affordable furniture options. Despite these fluctuations, user engagement remained robust, with video views surging by 23.35% and live stream views by 21.29%, highlighting the critical role of content in driving market activity. Looking at the broader trend, sales rebounded in May and June after a slight dip, reaching 27.7 million, showing a sustained upward momentum following a significant surge earlier in the year.
Three Commercial Insights from the Data
Dominance of Core Categories with Emerging Growth Opportunities
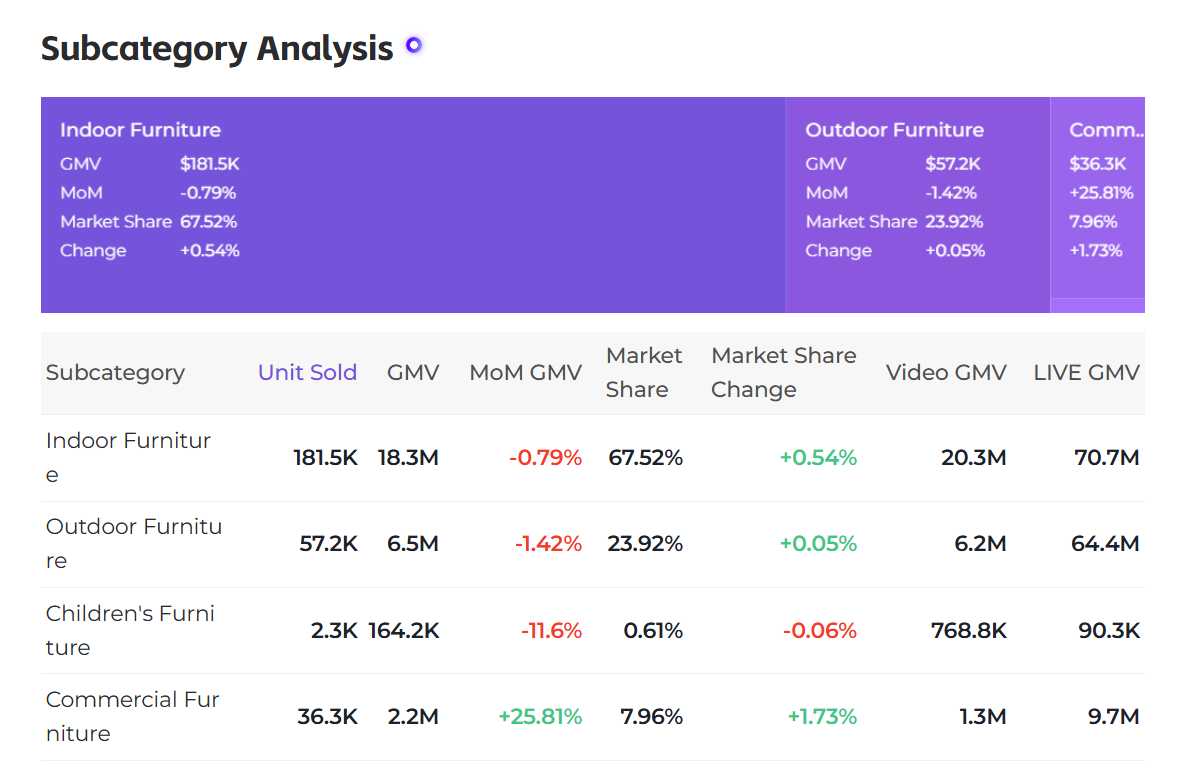
Indoor furniture and outdoor furniture continue to be the primary revenue drivers, accounting for a substantial 67.52% and 23.92% of the market share, respectively. However, the commercial furniture sub-category displayed remarkable growth, with sales increasing by 25.81% month-over-month. This indicates a burgeoning niche that sellers can explore for diversification and high-growth potential, complementing the established popularity of residential furniture.
The Sweet Spot for Pricing and Transaction Value
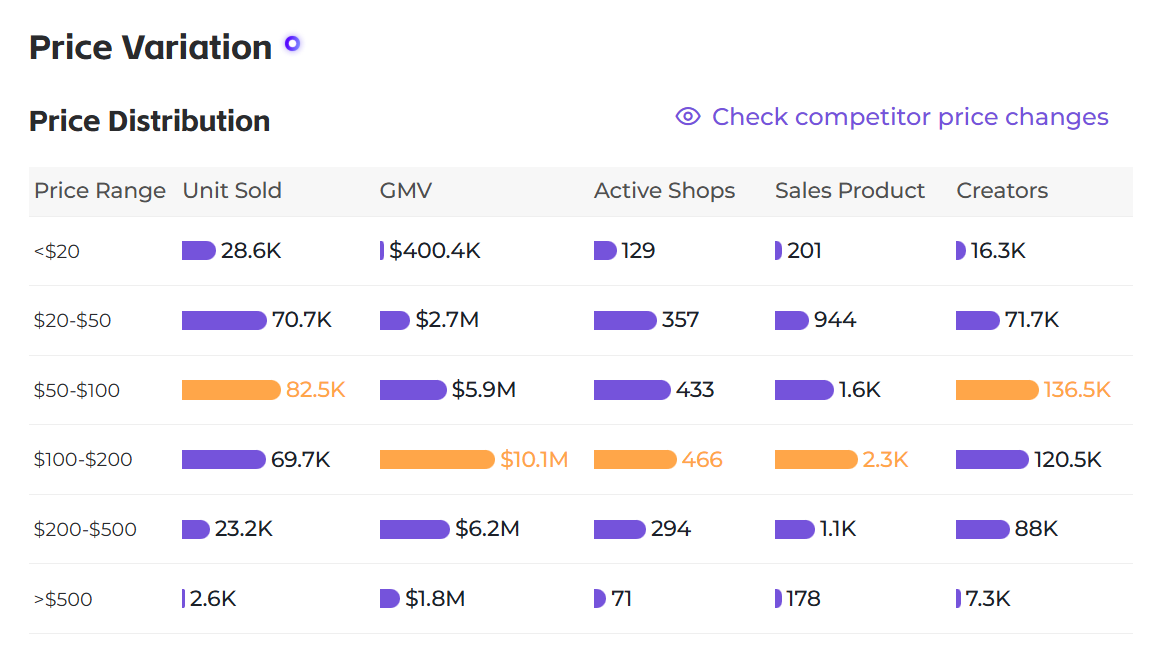
The data reveals that price ranges between $100-$200 generate the highest sales amount at $101.46 million, closely followed by the $50-$100 range at $58.88 million. This suggests that the mid-range price points are most competitive and appealing to the majority of TikTok Shop furniture consumers. Products priced above $200, especially those over $500, show significantly lower sales volume, indicating a limited demand for high-end items and suggesting they may be best positioned as supplementary offerings rather than core inventory.
Content as a Core Sales Driver
The significant increases in video views (23.35%) and live stream views (21.29%) underscore the profound impact of visual and interactive content on consumer engagement and sales conversion. This trend confirms that active and optimized short video marketing and live streaming are not merely supplementary but essential strategies for reaching and converting audiences within the TikTok Shop ecosystem.
Optimization Strategies for Sellers in July
To capitalize on these insights and enhance performance in July, sellers can implement targeted strategies across product selection, pricing, and content:
Product Selection
Focus on Core and Emerging Categories: Continue to prioritize popular indoor and outdoor furniture items, which consistently drive the bulk of sales. Simultaneously, actively explore and expand offerings in the rapidly growing commercial furniture segment to tap into new demand and diversify your product portfolio.
Target Mid-Range: Given the strong performance of products in the $50-$200 range, focus on sourcing and promoting items that fall within these popular price brackets to align with consumer purchasing habits and maximize conversion rates.
Pricing
Optimize for Value: Continue to offer competitive pricing, particularly within the $50-$200 range, where demand is strongest. Consider bundling options or promotions to enhance perceived value without drastically cutting prices.
Content
Prioritize Video and Live Streaming: Given the strong growth in views, invest heavily in producing high-quality, engaging short videos and conducting regular live stream sessions. These formats are crucial for product demonstration, answering customer questions in real-time, and building community.