June TikTok Automotive & Motorcycle Category Insights: Understanding Industry Growth Logic and Breakthrough Strategies Behind $30.46M in Sales Introduction: Structural Changes Behind the Rise in Volume and Price
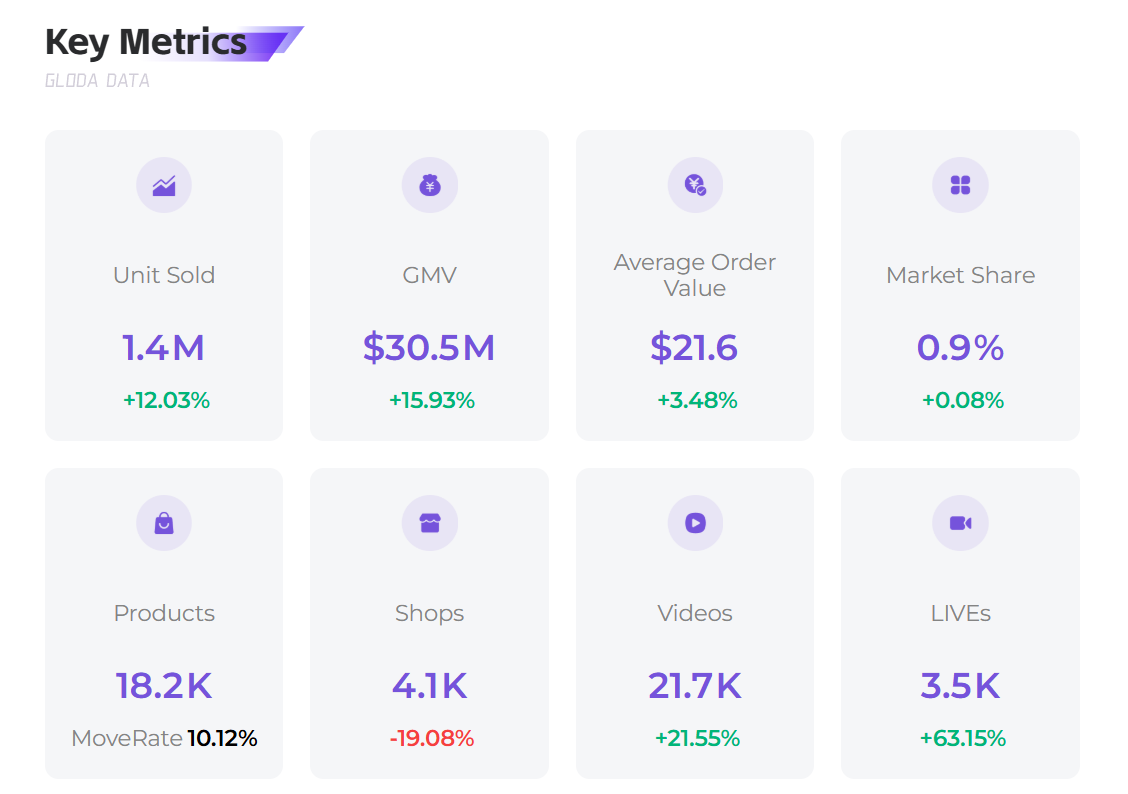
In June 2025, TikTok Shop’s U.S. automotive and motorcycle category delivered impressive results with $30.46 million in sales (MoM +15.93%) and 1.413 million units sold (MoM +12.03%). A deeper shift is reflected in the rise of the average transaction price to $21.6 (MoM +3.48%), signaling a transition from "low-price volume selling" to "value-based competition."
This article adopts a data-theory-practice analysis framework to break down the core logic behind the growth and provide actionable strategy guides for sellers.
I. In-Depth Analysis of Core Indicators: Three Key Industry Patterns Revealed by Data
1. Price Band Economics: The Golden Threshold Effect of $20–$50
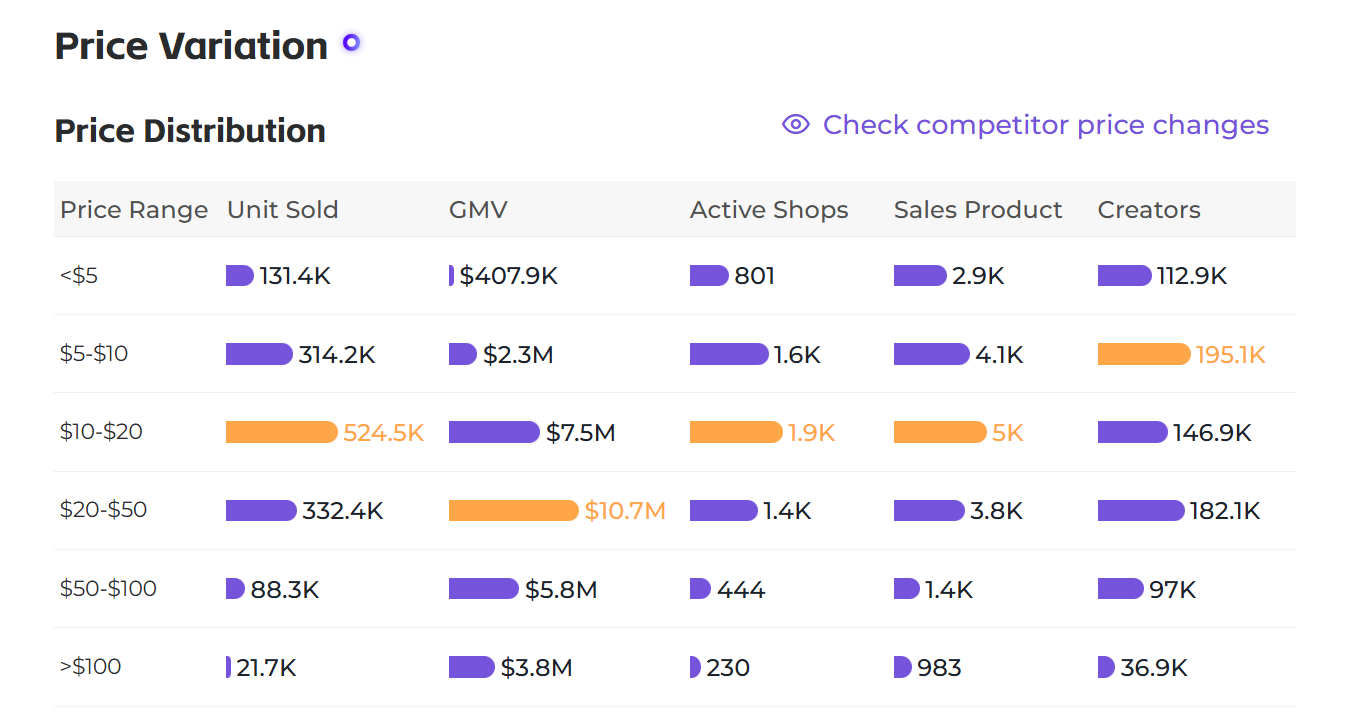
June price band data showed a clear "threshold distribution" pattern:
● $20–$50 price band: Accounted for 35% of total sales ($10.667 million), with 332,000 units sold. The price elasticity coefficient reached 1.8 (a 10% price increase only led to a 5.6% drop in sales), verifying the “comfortable purchase threshold” theory — prices in this range meet consumers’ expectations of quality without crossing the “deliberation” threshold.
● >$100 price band: Although only 22,000 units were sold, per-unit profit contribution was 4.3 times higher than the $10–$20 band, aligning with the "long tail effect" seen in high-value niche markets.
2. Content Funnel: The Underlying Logic Behind Livestreams Outperforming Short Videos
June content marketing data revealed a "traffic quality hierarchy" phenomenon:
● Short videos: 22,000 videos accounted for 32% of traffic, with a conversion rate of 2.1% (wide but shallow funnel).
● Livestreams: 3,462 sessions accounted for 28% of traffic, with a conversion rate of 5.8% (narrow but deep funnel).
Theoretical explanation:
According to the "engagement–conversion correlation" model, livestreams' real-time interactivity (comments, likes, Q&A) increases user engagement to three times that of short videos, and each 10% increase in engagement boosts conversion by an average of 2.3%.
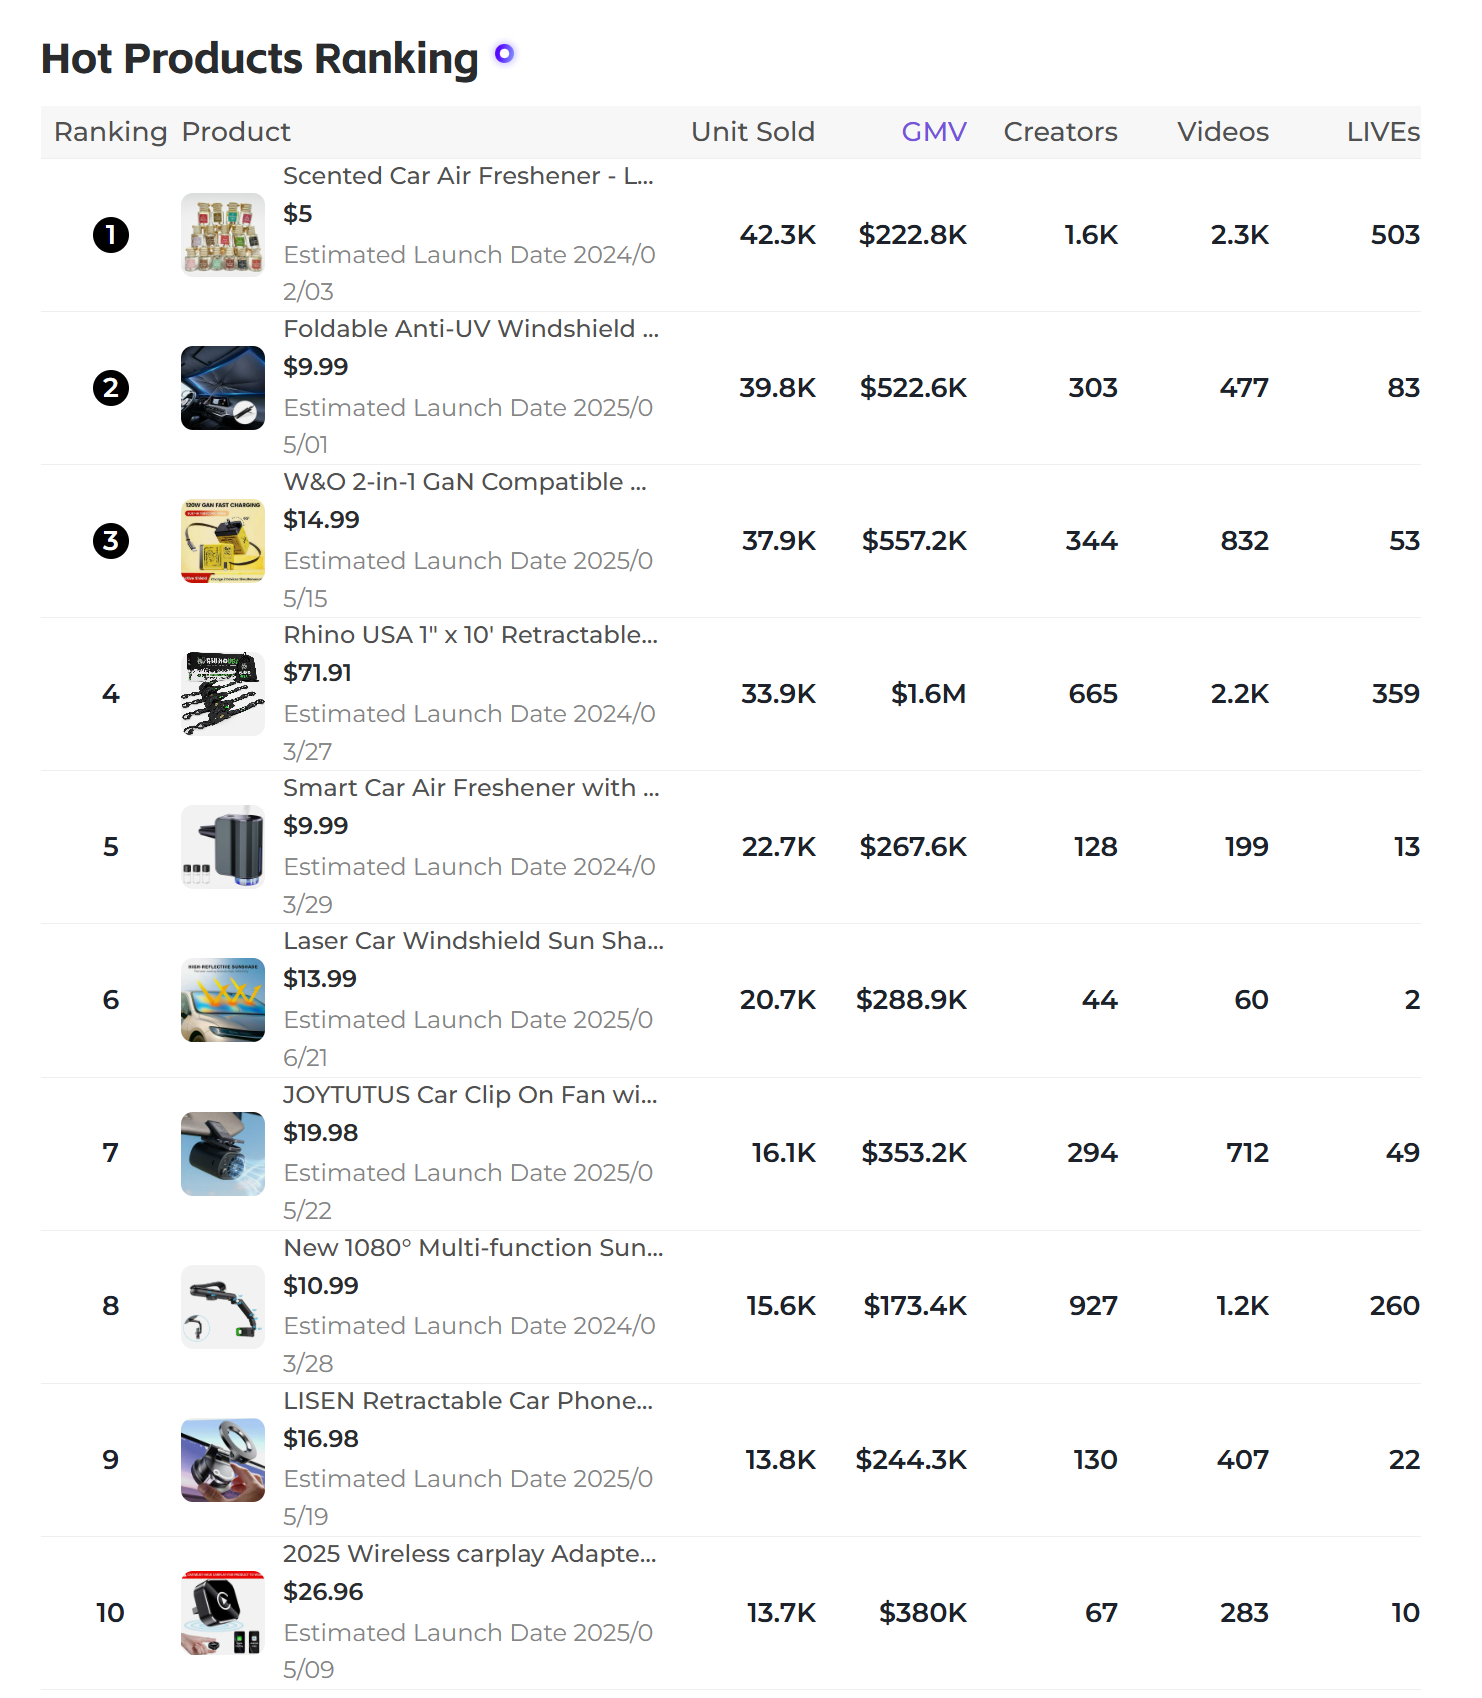
For example, a bestselling sunshade used live in-car temperature tests showing a 15°C drop to drive significantly higher conversions than static video demos.
3. Intensified Matthew Effect: CR10 Accounting for 32% of Sales
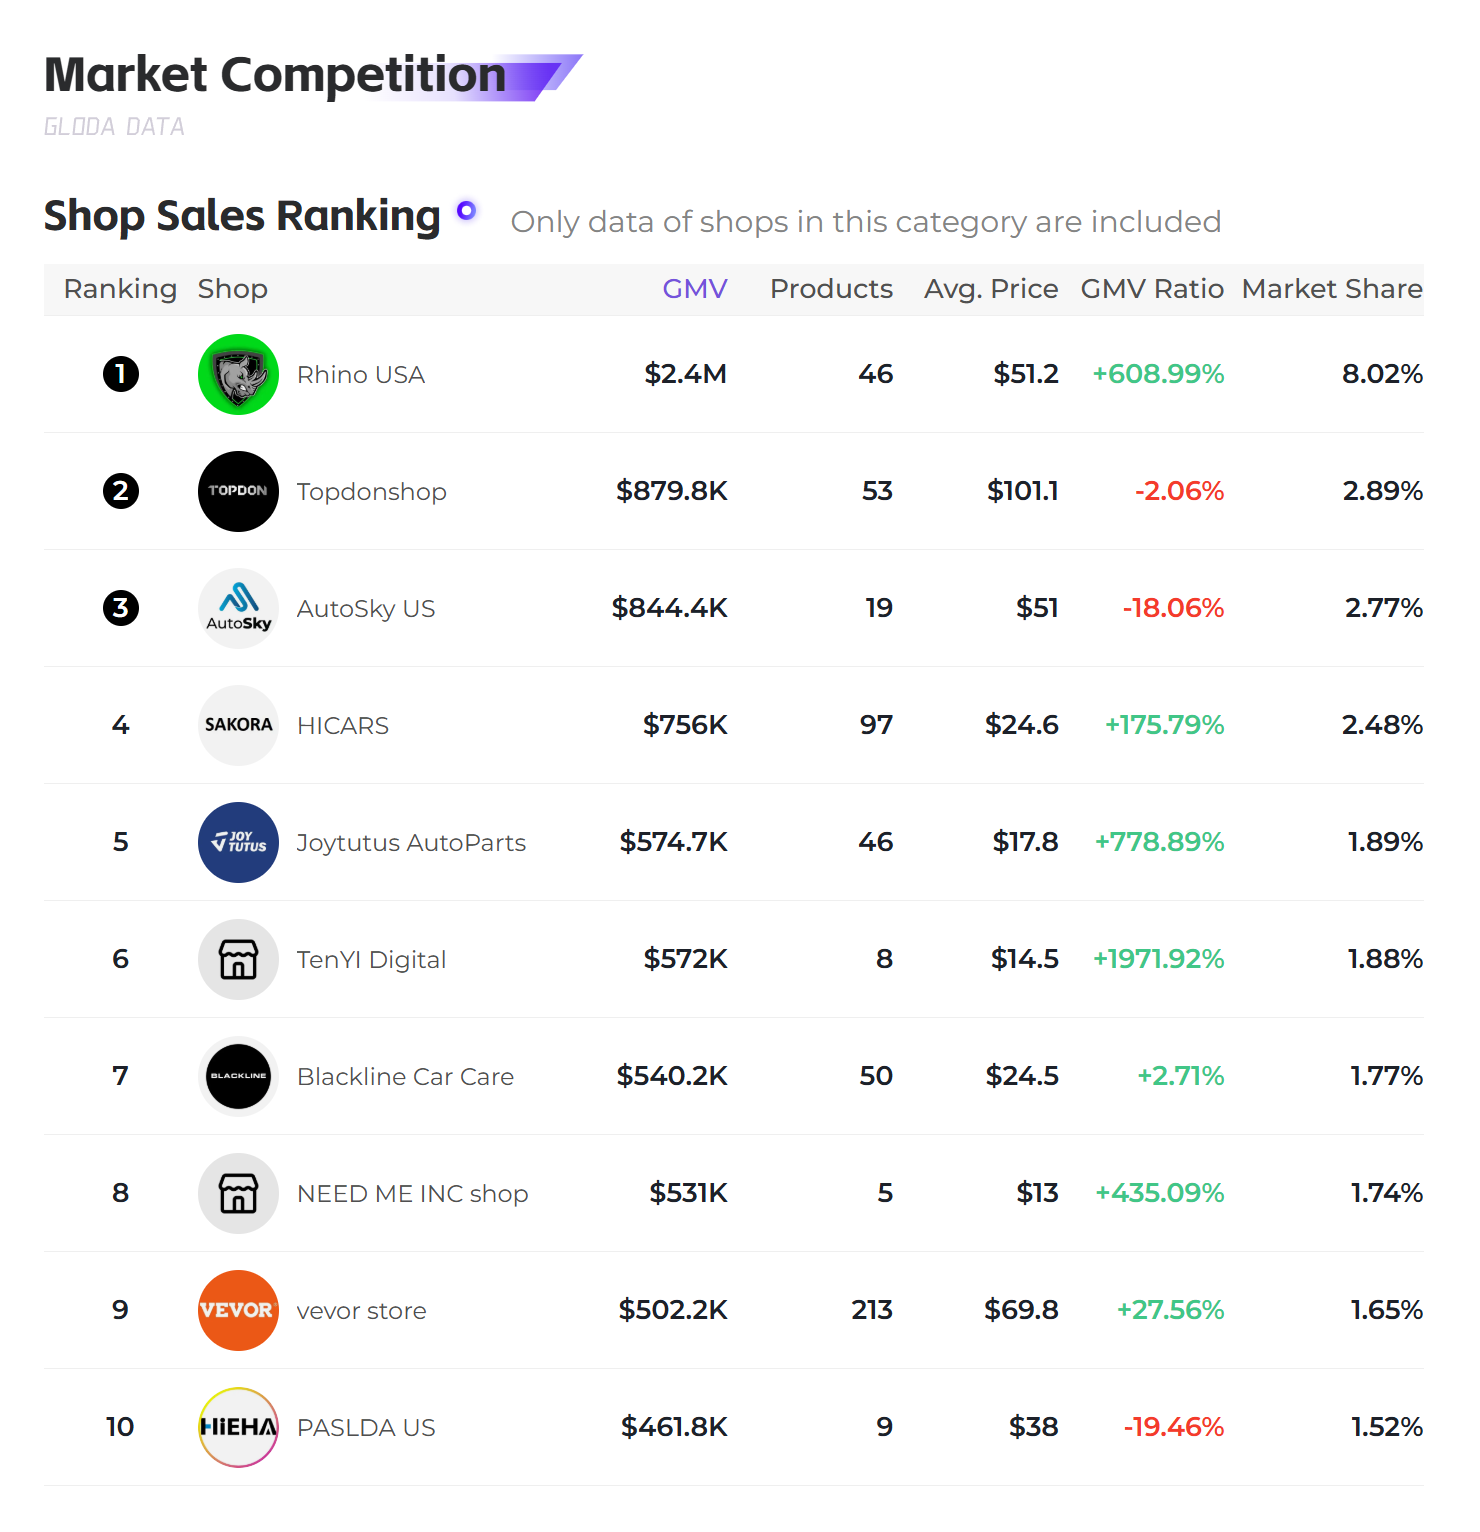
The top 10 stores contributed 32% of total sales, reflecting a typical "winner-takes-all" dynamic:
● Rhino USA (Rank 1): Achieved $2.442 million in sales with an average unit price of $512, thanks to “professional scenario positioning” (off-road rescue tools) and “brand premium building” (via expert KOL reviews).
● TenYI Digital (Rank 6): Generated $1.572 million in sales with only 8 SKUs (MoM +1971.92%), validating the "extreme single-product strategy" as a way to break through in a high-concentration market.
Breakthrough paths for small and mid-sized sellers:
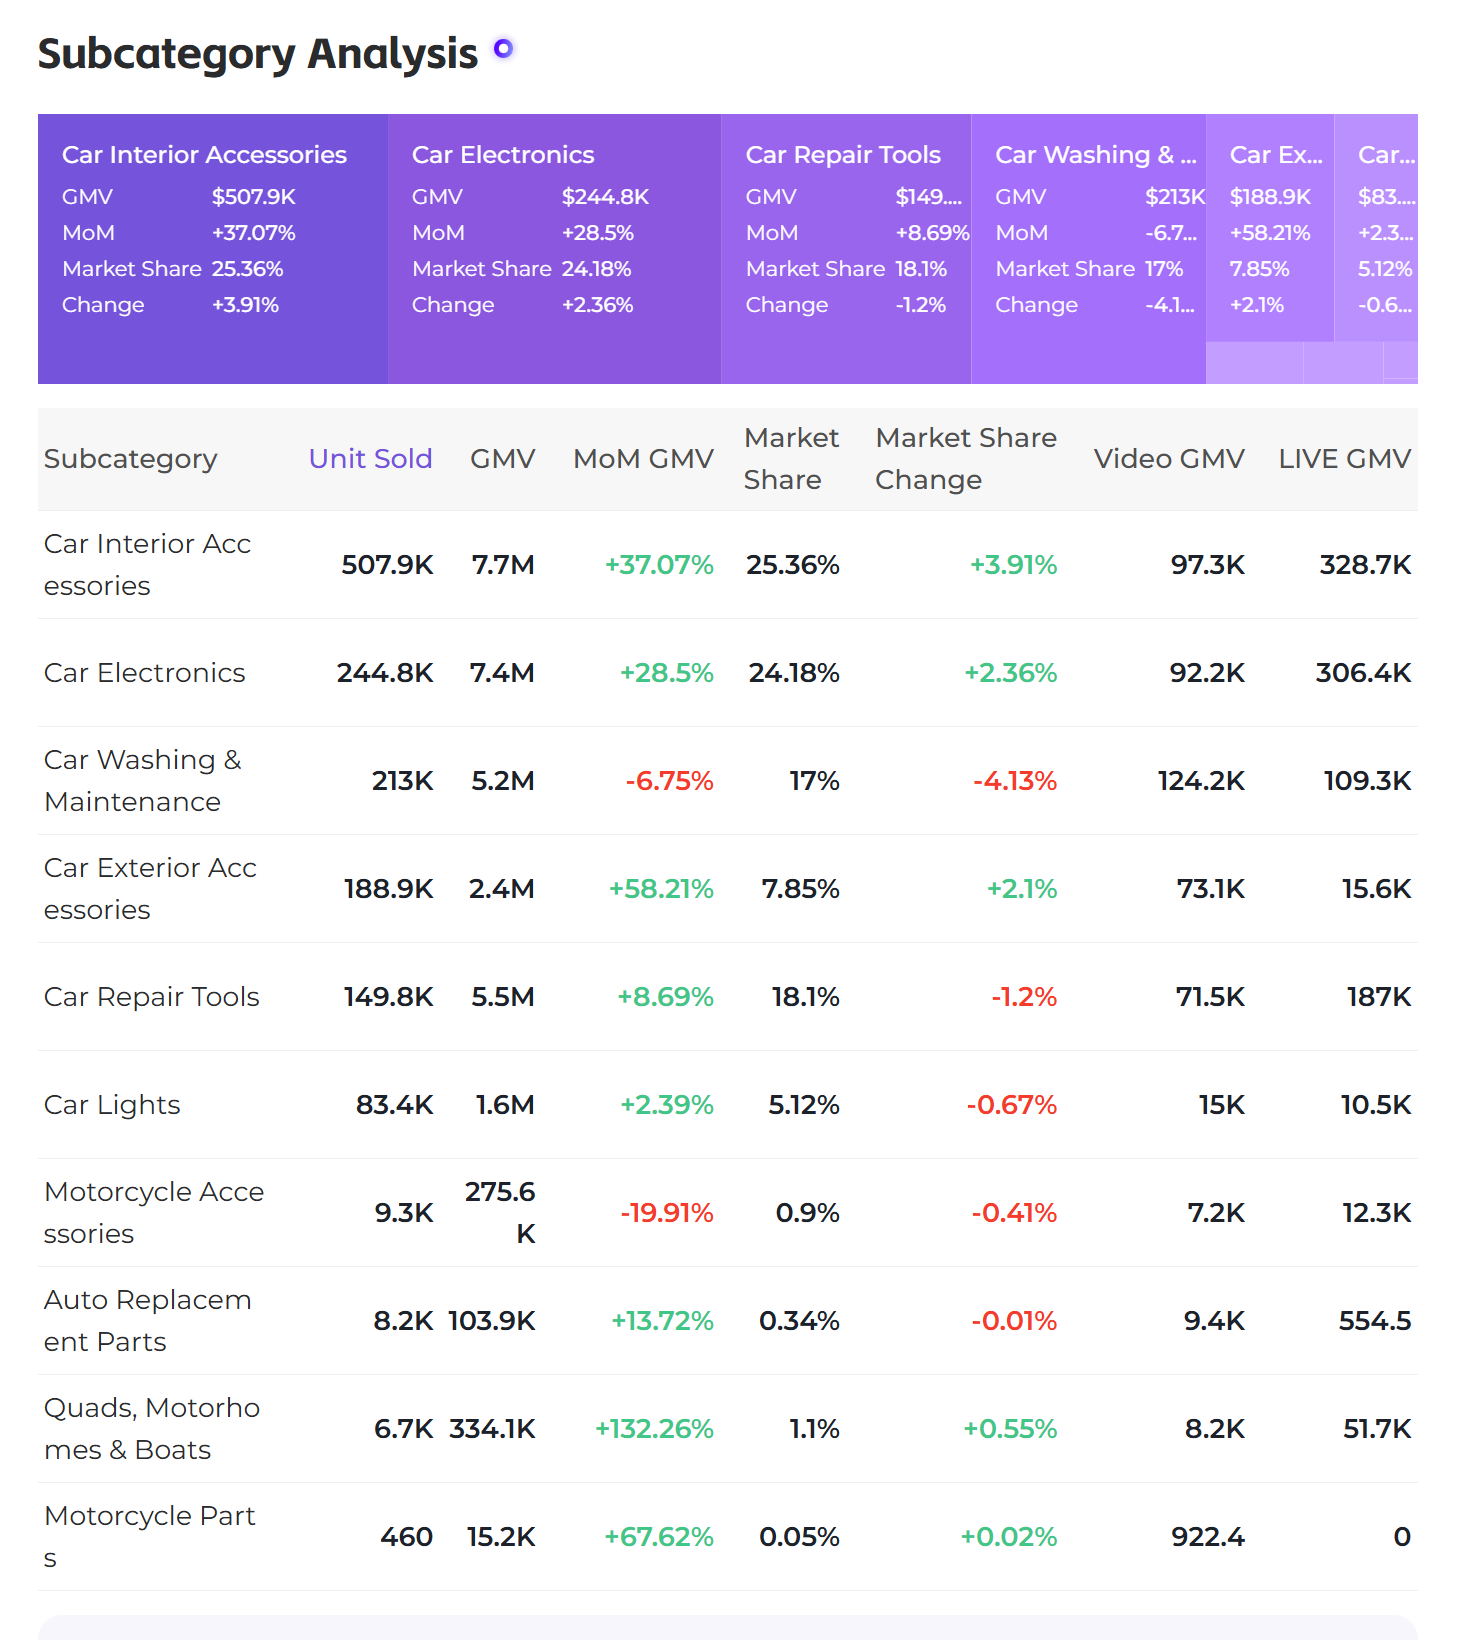
Avoid competing in the CR10-dominated interior accessories market (25.36% share), and instead pivot to low-concentration, high-growth categories like beach vehicle equipment (1.1% market share, MoM +132.6%), aligning with the “value innovation” principle in Blue Ocean Strategy.
II. Subcategory Lifecycle Analysis: Differentiated Strategies for 3 Growth Stages
1. Growth-Stage Categories: Interior Accessories and Automotive Electronics
● Interior accessories ($7.726 million, +37.07%): In mid-growth phase, characterized by “high replacement frequency + standardized production.” Suggested strategy: “multi-SKU coverage” (e.g., offer 10 materials of seat cushions).
● Automotive electronics ($7.367 million, +28.5%): In early growth phase, with rapid technological updates (e.g., wireless charging upgrading from 15W to 30W). Product update cycle should be every 3 months.
2. Introduction-Stage Category: Blue Ocean Opportunity in Beach Vehicle Equipment
This category grew by 132.6% MoM, entering the late introduction phase but with market penetration below 2%. Success depends on:
● Scenario-based product design: e.g., “portable RV water purifiers” solving long-trip water needs.
● Precise traffic acquisition: Targeted ads via "RV travel" interest tags — CPM is 40% lower than broad targeting.
3. Declining-Risk Category: Transformation Suggestions for Car Wash & Maintenance
This category had sales of $5.177 million (MoM -6.75%), entering the late maturity phase. Suggested actions:
● Product bundle upgrades: Launch "cleaning + maintenance" sets (e.g., car wash + interior cleaner combos).
● Value-added services: Use short videos to provide DIY car wash tutorials and boost product value.
III. Data-Driven Seller Action Guide
1. Price Band Portfolio Strategy
● Core matrix:
○ 60% of SKUs in $20–$50 (balance between volume and margin)
○ 30% in >$100 (high-margin offerings)
○ 10% in <$10 (traffic drivers)
● Dynamic adjustment: Analyze price band ROI monthly. Eliminate SKUs with ROI <1 for two consecutive months (e.g., basic $5–$10 car wipes).
2. Content Operations Optimization
● Short videos:
○ First 3 seconds: Inject “scenario conflict” (e.g., “Driving in summer = steam room?”)
○ Next 5 seconds: Show product features
○ Final 3 seconds: Call to action
● Livestreams: Use a “three-segment structure” —
○ 10 minutes: Scenario and problem setup
○ 30 minutes: Product demonstrations
○ 20 minutes: Limited-time flash deals
3. Tool-Assisted Decision Making
It is recommended to use the Gloda data product selection tool, focusing on these three core features:
● Monthly industry reports: Gain early growth signals for subcategories like interior accessories.
● Creator matching: Filter high-conversion creators by niche tags like “car modification.”
● Price band analysis: Spot real-time opportunities in golden bands like $20–$50.
(Note: Tool functions are objective recommendations; effectiveness may vary based on seller capabilities.)
Conclusion: From Data to Strategic Decision-Making
June’s industry data not only reveals opportunities like the $20–$50 price band, livestream conversions, and blue ocean categories, but also validates the relevance of "price threshold theory," "engagement-conversion model," and "blue ocean strategy" on TikTok.
Sellers must evolve from "data collection" to "pattern recognition" to continually break through in a $30.46M market.
The future of competition lies not in how much data one has, but in one’s ability to extract actionable insight — this is the critical leap from operational execution to strategic judgment.