TikTok's US home furnishings category saw a 25.59% sales surge in July – analyzing growth secrets and product selection strategies from four perspectives.
I. Overview: Q3 Peak Season Kicks Off Early, Home Products Sees 25.59% Sales Explosion
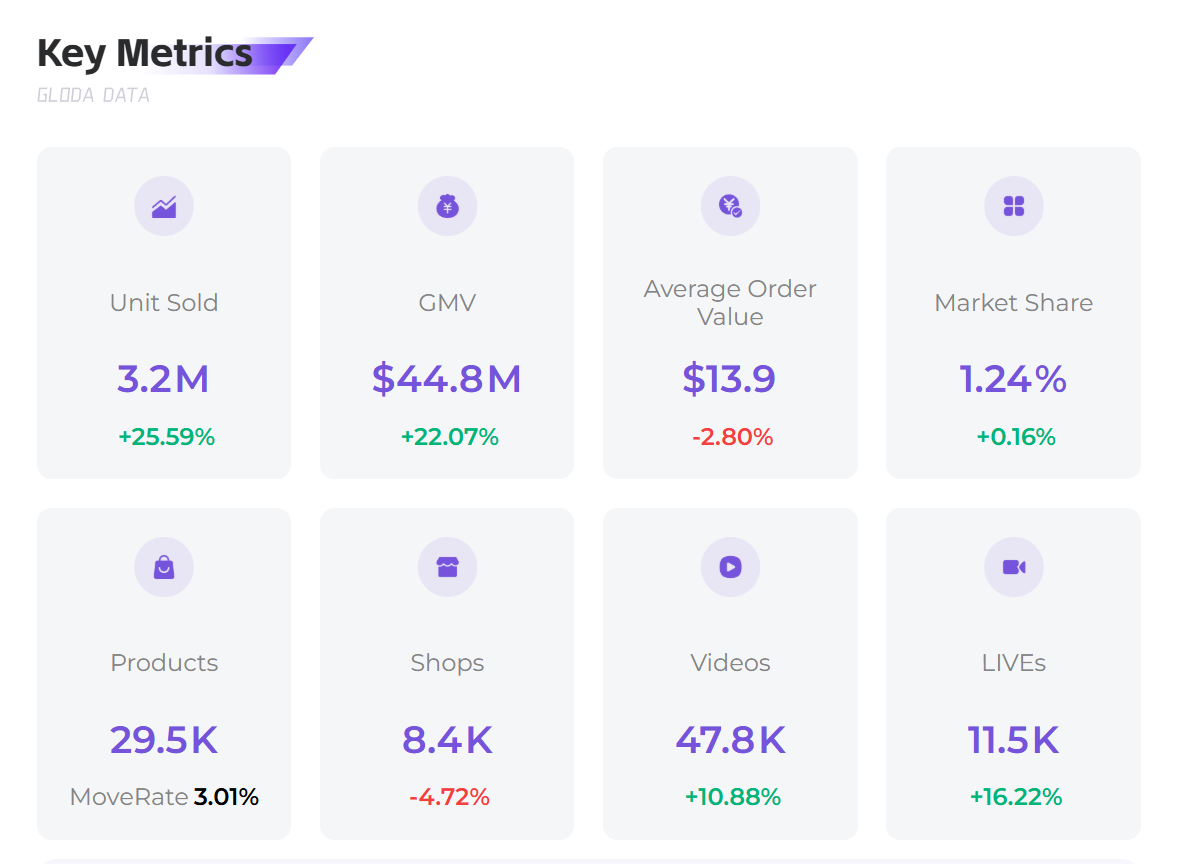
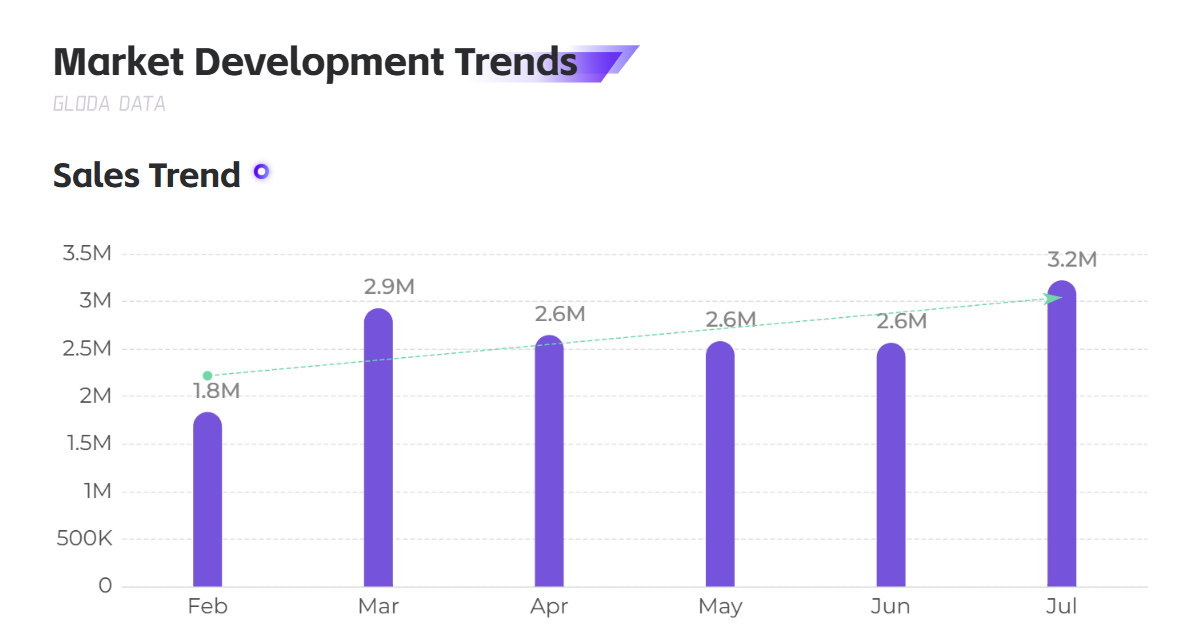
In July 2025, the TikTok Shop US home products market demonstrated strong growth, with core data reaching a new high for the year. According to the latest industry report, sales across all categories reached 3.221 million units, a year-on-year increase of 25.59%, while sales revenue exceeded US$44.8 million, a year-on-year increase of 22.07%. Notably, despite a 2.8% year-on-year decrease in average transaction price, market share still increased by 0.16 percentage points to 1.24%, reflecting the optimization of the overall supply and demand relationship in the industry and the unleashing of consumer potential.
By segment, festive and party supplies emerged as the biggest surprise, with a month-on-month growth of 49.69%, followed by decorative items and home storage, with growth rates of 21.09% and 14.52%, respectively. This data not only reveals the continued rise in American consumers' demand for improved home environments in the post-pandemic era, but also provides clear direction for cross-border merchants' product selection and layout in the second half of the year.
II. In-depth Analysis of Industry Track Data from Four Dimensions
(I) Overall Industry Trends: Strong Growth Momentum, with Significant Contribution from Livestreaming E-commerce
1. Market Size and Growth Rate
In July, the US home furnishings market continued its growth momentum since Q2, with both sales and dollar value reaching new annual highs. Comparing quarterly data, sales in the first month of Q3 (July) reached 118% of the average monthly sales in Q2, indicating an early onset of peak season activity. This was driven in part by consumer spending stimulated by Independence Day (July 4th) and the back-to-school season, and also reflects the continued growth of TikTok Shop's traffic dividend.
2. Changes in Channel Structure
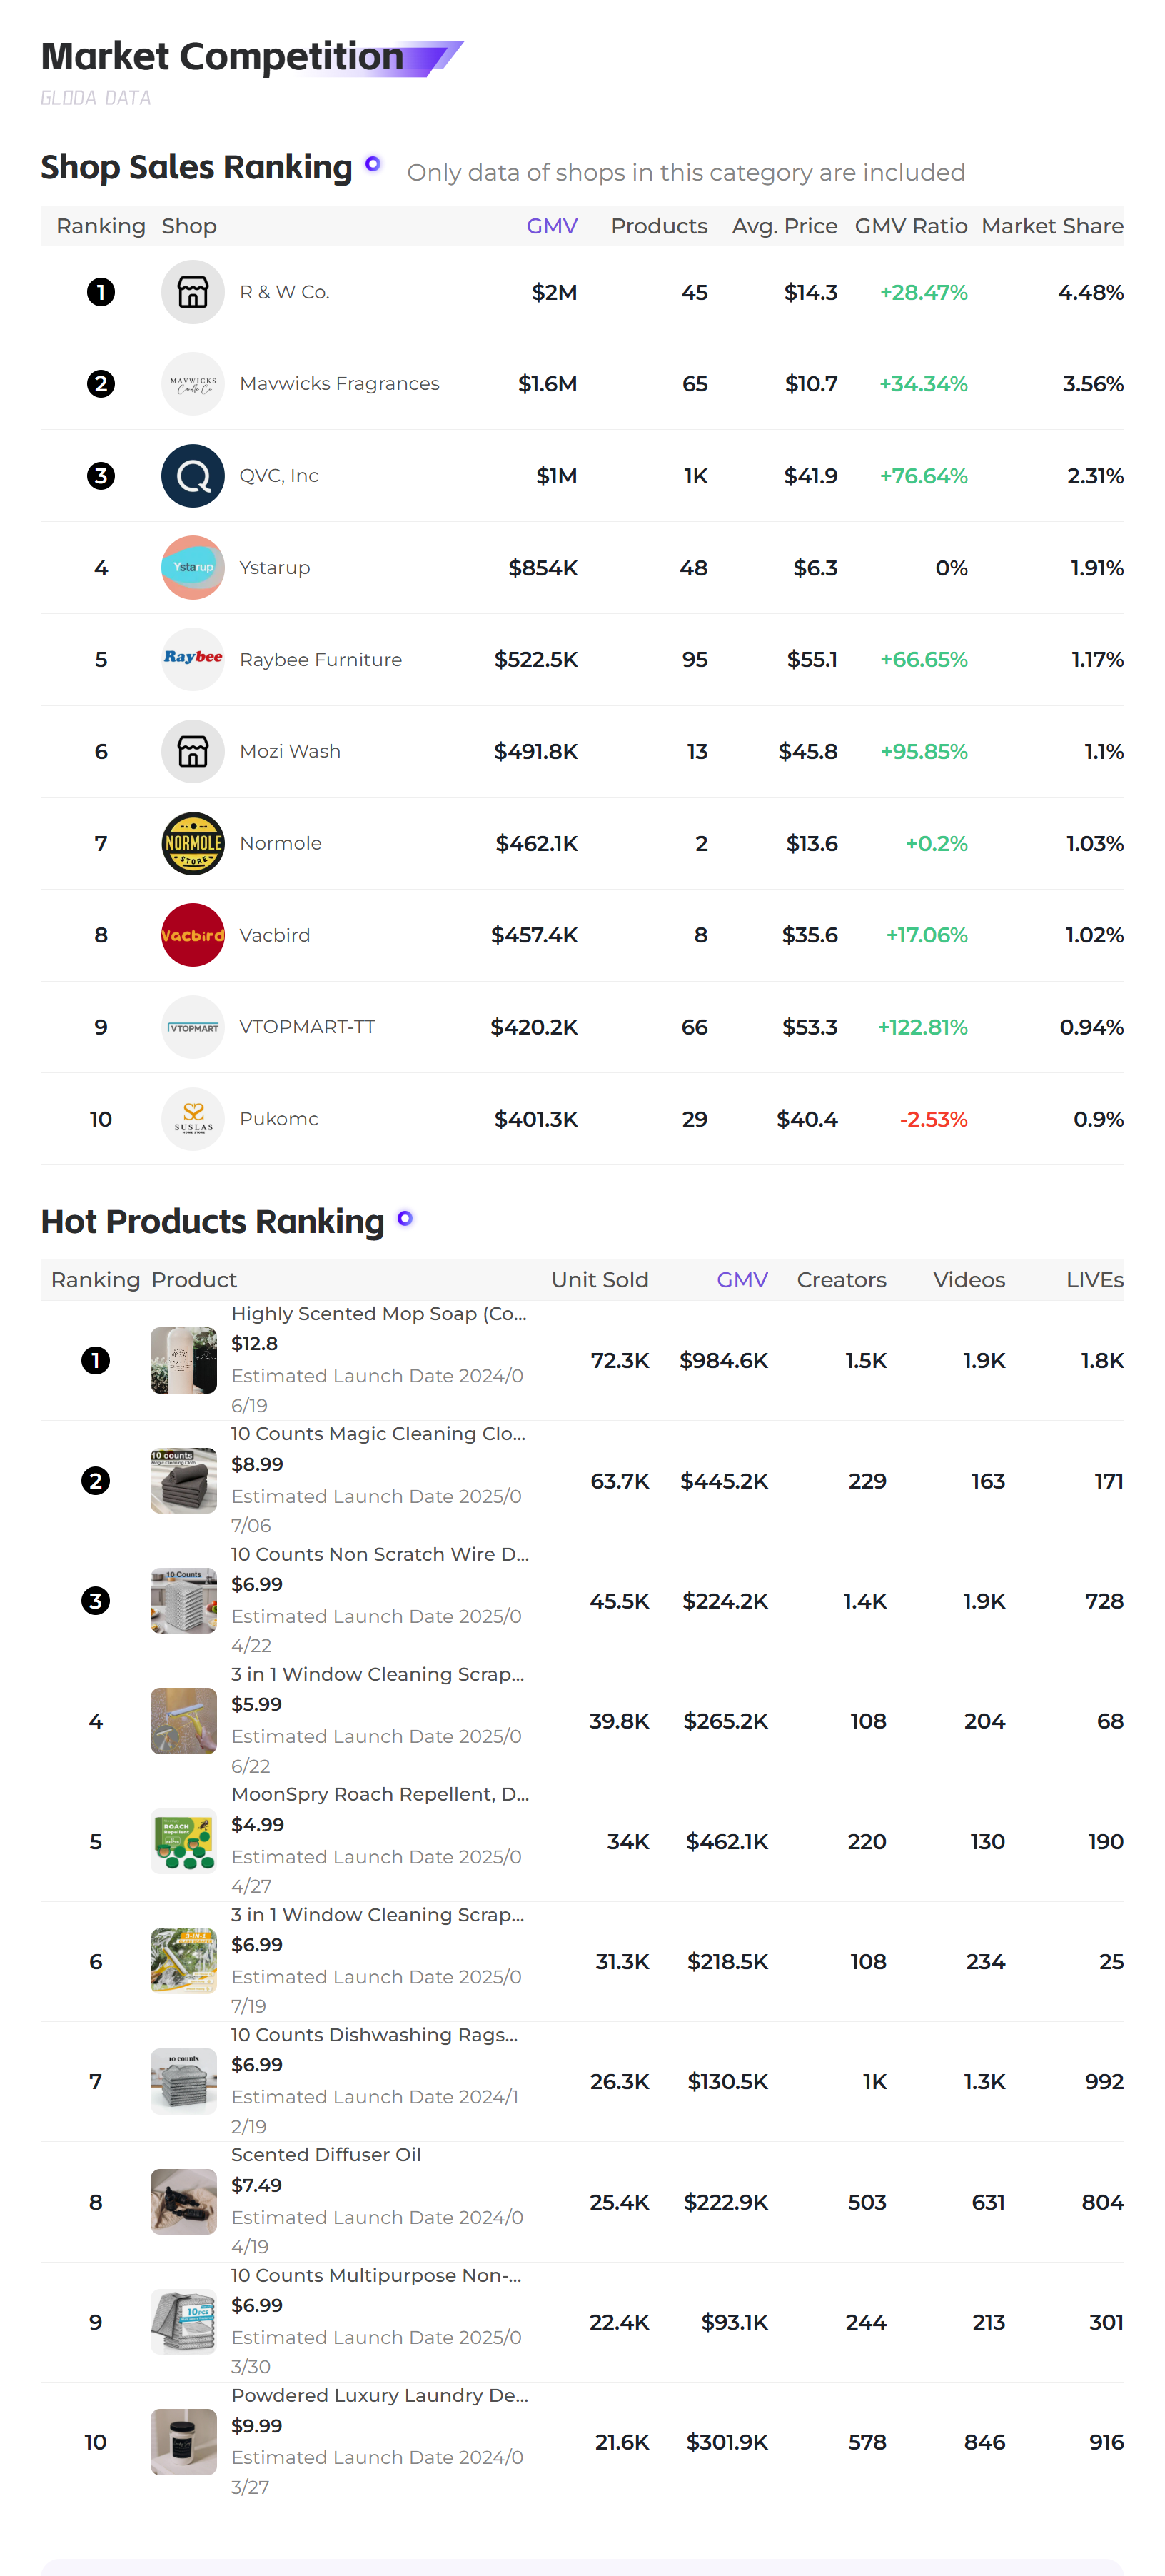
Livestreaming e-commerce has become a core engine driving growth. Data shows that livestreaming accounted for 38.7% of sales in July, with home care products showing particularly strong conversion rates. Highly Scented Mop Soap, a top product, achieved $985,000 in sales through 1,807 livestreams, with livestream contributing 62% of its total sales. Furthermore, short video content has proven effective in generating buzz, with product impressions generated by 48,000 related videos increasing by 10.88% year-on-year.
3. User Behavior
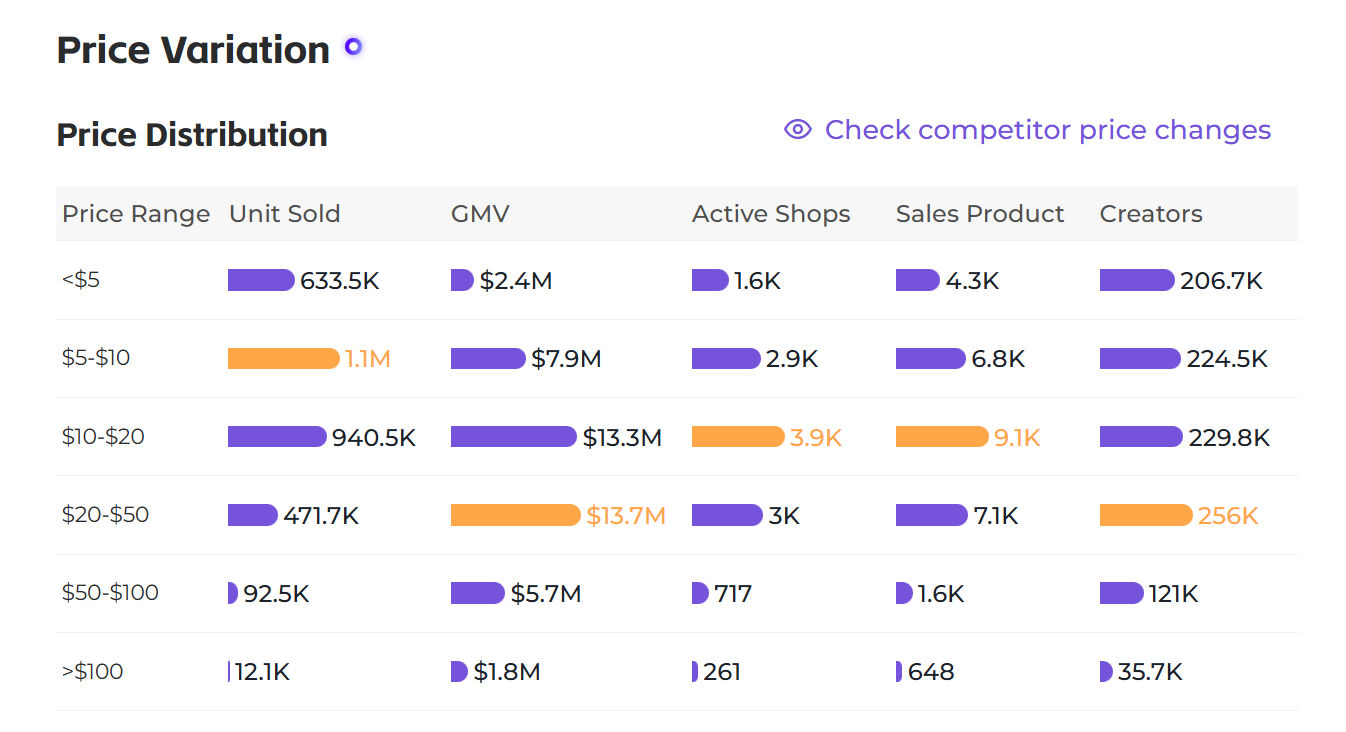
Analysis of purchase data reveals three key trends in US consumer home product purchases: First, a focus on value, with products in the $5-$20 price range accounting for 65% of sales; second, a preference for multifunctional products, such as 3-in-1 window cleaners, which saw monthly sales of 71,000 units; and third, a focus on health and safety, with searches for natural cleaners and eco-friendly storage products increasing by 47% year-on-year.
(II) Price Range Competition: The $5-$20 price range is the golden age, with cost-effective strategies dominating the market.
1. Price Stratification and Market Performance
July data shows that different price ranges exhibit differentiated competitive dynamics:
a. $5-$10 price range: With sales of 1.071 million units, it holds a 33.2% market share, becoming a veritable "traffic driver." Representative products such as the 10 Counts Magic Cleaning Cloth, priced at $8.99 and achieving monthly sales of 64,000 units, demonstrate the effectiveness of the affordable strategy on the TikTok platform.
b. $10-$20 price range: Contributing 38.3% of sales ($13.28 million), it represents the optimal balance between profit and sales volume. Products in this price range have an average turnover rate of 3.01%, exceeding the industry average.
c. $20-$50 price range: With sales of 472,000 units, it generated $13.7 million in sales, demonstrating a significant advantage in average order value. Raybee Furniture achieved $523,000 in sales and a 66.65% month-over-month growth through its small, multifunctional furniture in this price range.
2. Pricing Strategy Recommendations
Based on market data, we recommend adopting a "pyramid" pricing structure: using lead-in items priced between $5 and $10 to attract traffic and sales, core items priced between $10 and $20 to contribute to core profits, and high-end items priced between $20 and $50 to build brand image. A successful QVC store, utilizing this combined strategy, achieved a 76.64% month-over-month sales increase despite offering 1,030 SKUs.
(III) Subcategory Analysis: Festive Supplies Exploded, Highlighting the Potential of Three Major Markets
1. Festive and Party Supplies: A Short-Term Bonus Window with a 49.69% Growth Rate
In July, the festive and party supplies category experienced a significant surge, reaching $260,000 in sales, a 49.69% month-over-month increase and a 1.44 percentage point increase in market share. By segment, Independence Day-themed decorations accounted for 58%, while back-to-school-related products accounted for 32%. Notably, the product lifecycle in this category is relatively short (average 30-45 days), requiring merchants to seize opportunities and quickly launch new products.
2. Decorations: Structural Opportunities with a 21.09% Growth
With 605,000 units sold and $9.309 million in sales, the decorations category became the second-largest subcategory after home care products. Modular and reusable products performed particularly well, such as Mavwicks Fragrances' fragrance collection, which generated $1.596 million in sales across 65 SKUs, a 34.34% month-over-month increase.
3. Home Storage: A Demand-Driven Market with a 14.52% Growth
The home storage category continued its steady growth, reaching $8.624 million in sales. Data shows that searches for specialized storage products for small apartments increased by 72% year-over-year, with foldable and wall-mounted designs being particularly popular. The Ystarup store achieved $854,000 in sales with 48 storage SKUs, demonstrating the feasibility of deep-dive development in a specific vertical category.
(IV) Competitive Strategies and Market Opportunities: Insights from the Top Players on the Path to Success
1. Single Product Hit Strategy: Mozi Wash's 95.85% Growth Miracle
Mozi Wash, ranked sixth, generated $492,000 in sales with 13 SKUs, a remarkable 95.85% month-over-month increase. Its core dishcloth product, dishwashing cloths, achieved a small but impressive operational breakthrough through differentiated design (antibacterial material + multiple size combinations) and targeted influencer collaboration (108 vertical cleaning influencers). This case study demonstrates that in the highly competitive home furnishing market, single product hits remain an effective path for small and medium-sized businesses to break through. 2. Full Category Coverage: R & W Co. Continues to Lead
Top store R & W Co. achieved $2.008 million in sales across 45 SKUs, maintaining its top position for six consecutive months. The keys to its success are: first, a precise grasp of the core home care product category, capturing a 36.39% market share; second, the establishment of a comprehensive influencer matrix, with 1,486 collaborating influencers forming a content distribution network; and third, rapid response to market changes, keeping new product launch cycles within seven days.
3. Common Characteristics of High-Growth Stores
Analysis of fast-growing stores such as VTOPMART-TT (+122.81%) and Raybee Furniture (+66.65%) revealed three common characteristics: first, a focus on niche markets (such as pet-friendly home furnishings and RV-specific products); second, supply chain optimization to achieve price advantages exceeding 30%; and third, active participation in platform events to generate additional traffic and exposure.
III. Future Trends and Commercialization Summary
(I) Three Definite Trends
1. The Popularization of Smart Cleaning Devices
Data shows that sales of smart cleaning products in the $50-$100 price range increased by 89% month-over-month, with entry-level smart products such as smart trash cans and automatic soap dispensers experiencing the fastest growth. This trend indicates that, as technology costs decline, smart home products are penetrating the mass market from the high-end market, providing new growth opportunities for businesses.
2. Consumer Awakening of Sustainable Homes
Search volume for products labeled "degradable" and "eco-friendly materials" increased by 215% year-over-year, and their sales share increased from 8.3% last year to 14.7% this year. Despite a unit price of $13.60, Normole's degradable cleaning cloths generated $462,000 in sales, with a repurchase rate of 38%. This demonstrates that American consumers are increasingly willing to pay for sustainable home products.
3. The Rise of Scenario-Based Solutions
Single-function products are gradually being replaced by scenario-based combination solutions. For example, the average order value of a "kitchen cleaning set" (cleaner + rag + scraper) was 2.3 times higher than that of a single product, while its conversion rate increased by 58%. Pukomc successfully achieved $302,000 in sales by launching a "bathroom renovation set," demonstrating the commercial value of scenario-based thinking.
(II) Commercialization Opportunities and Strategic Recommendations
1. Product Selection
a. Short-term (1-2 months): Focus on back-to-school-related products, such as dormitory storage and mini appliances;
b. Medium-term (3-6 months): Develop Thanksgiving and Christmas-themed decorations to capture the holiday market;
c. Long-term: Focus on technological innovation and supply chain integration for smart home and sustainable products.
2. Operational Strategy
a. Content: Increase investment in livestreaming, drawing on the success of the home care category, which achieved $352,000 in livestream sales, and schedule at least three themed livestreams per week.
b. Product: Optimize the product mix in the $10-$20 price range to increase average order value and profit margins.
c. Channel: Actively expand influencer partnerships, focusing on mid-tier influencers with 10,000-100,000 followers, who offer better value for money.
3. Risk Mitigation
a. Be wary of homogenous competition and avoid blindly following trending products.
b. Monitor US CPSC regulatory updates to ensure product compliance.
c. Maintain reasonable inventory control, especially for seasonal holiday items.